Coming off the heels of Lebron James signing with the Lakers, Kevin Durant has certainly made some headlines this week, with rumors circulating that he might go back to Oklahoma City next summer, after signing a 1 + 1 deal with the Golden State Warriors. Others have said he wants to join Lebron at the Lakers, but I'm not here to speculate, friends. I'm just here to look at cold, hard data, yo.
This is not intended to be a head-to-head comparison by any means, but just a quick look at their overall shooting performance from this past season.
All data was from stats.nba.com and all plots were made with rstudio and toddwschneider's ballr, and Adobe Photoshop.
And with that, let’s get into it!
Overall Shooting
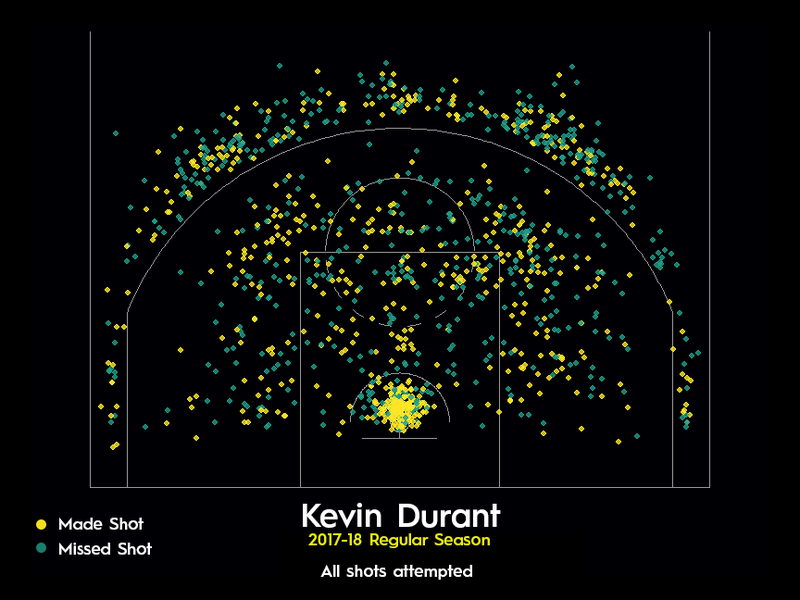
In the 2017-18 season, Kevin Durant made 1,219 field goal attempts (FGA) and made 630 of them for an overall field goal percentage (FG%) of 51.7%, which is 5.6% higher than the league FG% 46.1%.
From Plot 1, we can see that KD has a concentration of shots in several areas - the restricted area (245 FGA), above the break (370 FGA) on the left and right flank, and in the mid-range (393 FGA) near the top two corners of the key. These areas will become more apparent in the Plot 5 heat map. In addition, we can see that when it comes to 3’s, KD forgoes shooting from the corners and instead opts to shoot from beyond the arc.
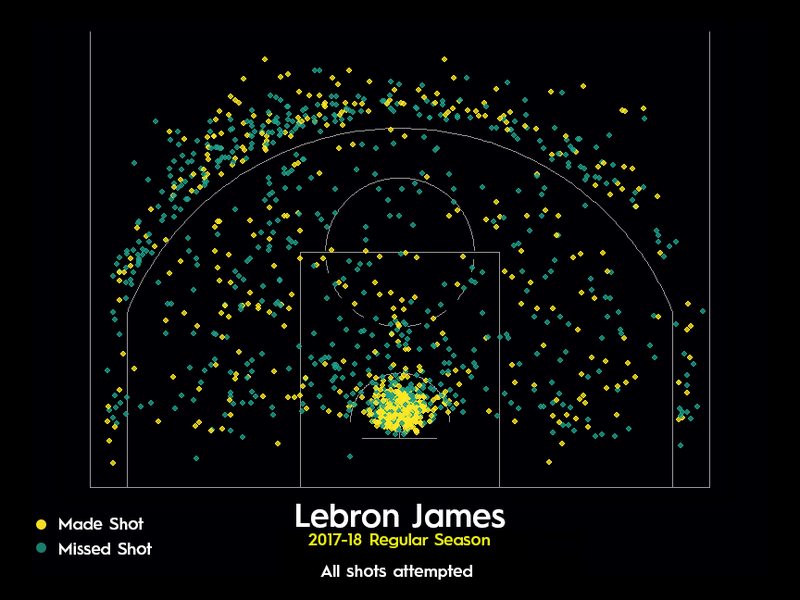
Lebron James in the 2017-2018 season made 1,579 field goal attempts and made 857 of them for an overall FG% of 54.3%, slightly more than 8% higher than the league average of 46.1%.
Plot2 shows an even heavier concentration of shots in the restricted zone (710 FGA) where Lebron makes a whopping 45% of his total shots here. We can also see another hot spot above the break on the left flank of the arc (367 FGA).
Next we’ll look at how successful these players are in converting these attempts to points on the board.
How do they compare to the rest of the NBA?
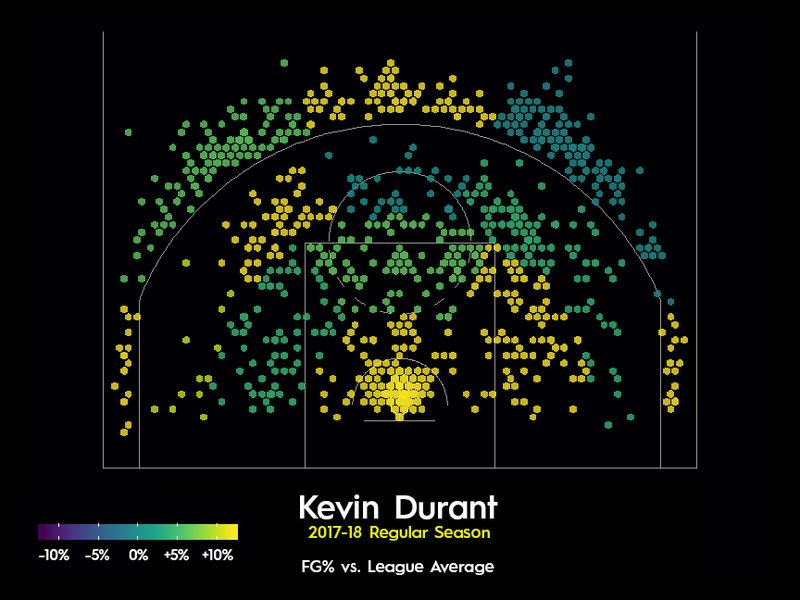
Plot 3 shows KD’s shooting percentage compared to the rest of the league. We can see that KD had a very good season, shooting 5-10%+ percent higher than the league in most spots on the court, only shooting below average, above the break right flank and above the key. Despite not taking many shots in the corners, KD has a higher than average shooting percentage in those areas.
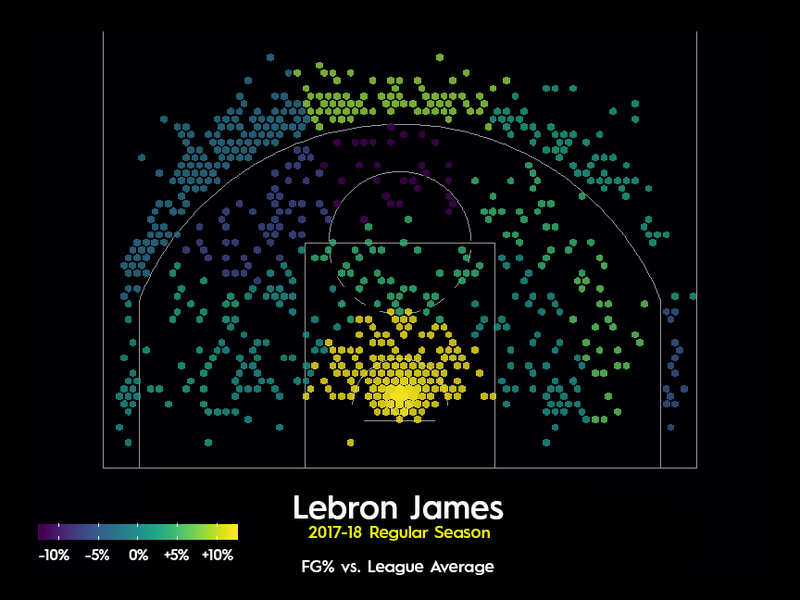
Lebron drives...alot. And he is quite successful too. In the restricted area, he has a whopping 75.2% success rate! Everywhere else though, he is merely average to slightly below average compared to the rest of the league. Above the key is his worst zone while a little bit beyond that above the arc he is ~5% above the league average.
Where do they like to shoot from?
Before I get into these heat maps, it is worth noting that these heat maps are separated by zones and that hotspots denote shot frequency (where these players like to shoot from). That is, I plotted in a way that shows the hot spots within each zone, so do not compare one zone’s hotspot with another. The reality is that for KD, he makes most of his shot attempts in the mid-range and above the break and Lebron as the King of the Key makes the majority of his shots in the restricted area. The three major zones I have separated is:
- The Key (not including the restricted area)
- The entire Mid-Range, and
- Above the Break
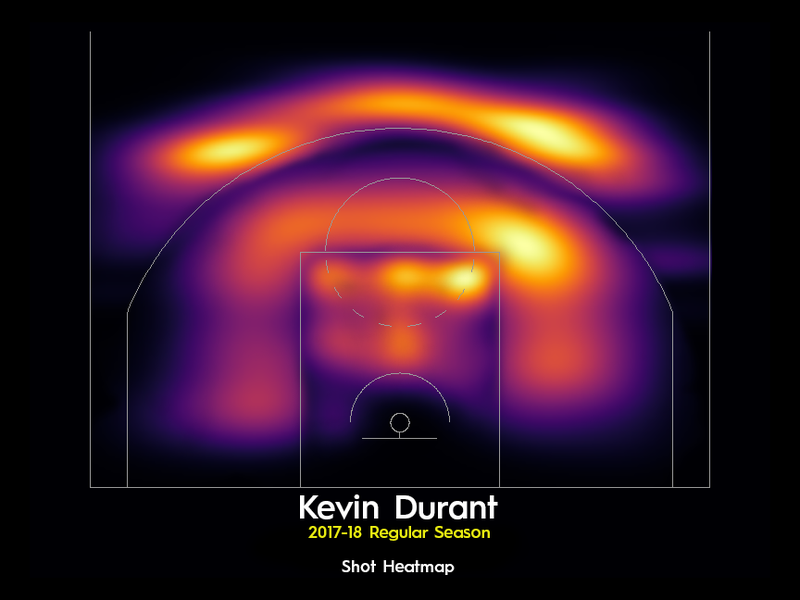
So with that preamble in place, we can see that KD prefers shooting on the right side of the court with major hotspots on the top-right corner of the key, mid-range zone slightly beyond that and even slightly more beyond that above the arc. It also looks like he separates the key into three parts, left, right, and middle.
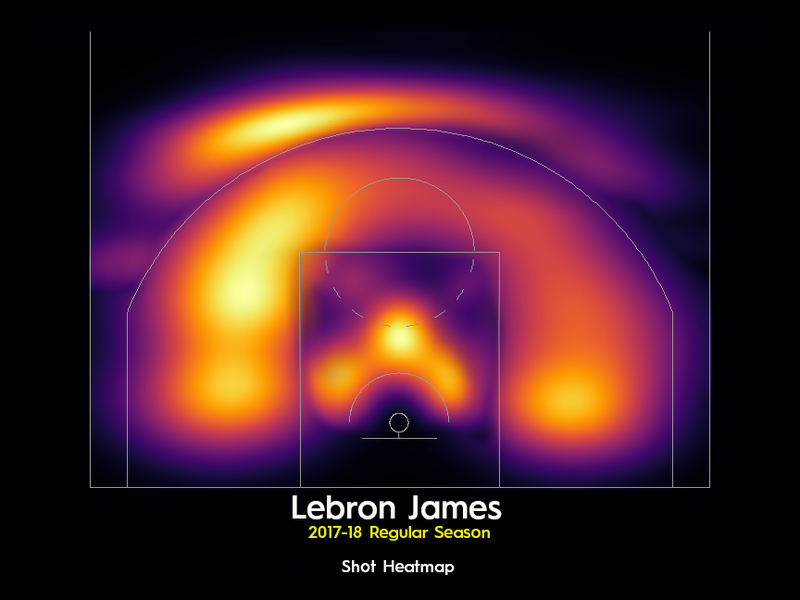
With Lebron, these hotspots do not factor in his restricted area shooting, which he greatly prefers over everything else. So this plot effectively shows where he shoots when he is not driving into the restricted area.
In contrast to KD, Lebron prefers the left side of the court. This shows up as hotspots near the top-left corner of the key and the left flank beyond the arc. Within the key though, Lebron likes to stick close to the restricted area.
Final Thoughts
Wow, it was very interesting looking into these plots. You can see things that never would've been apparent just from watching the games. There is no doubt that these are two phenomenal players, but as these plots show, their greatness comes in different ways...
As always, thank you for reading.
-Satoshi
Author's notes:
- All data was from stats.nba.com and all plots were made with rstudio and toddwschneider's ballr, and Adobe Photoshop.
- Image source was from: http://www.sportingnews.com/us/nba/news/nba-kevin-durant-lebron-james-on-same-level-warriors-cavaliers/1rjaz28t9xrgm1c2jx1ca1vbco
Comments