A little over a week ago I received an email from a man named Adam Levenson, who is the content manager for a company called Thinkful, a business revolved around data science. Adam had emailed me because one of his graduates from a boot camp he teaches had created a model representing some interesting NFL statistics that he wanted to share with me.
The creator of this model is Albert Troszczynski. If you would like to read the whole blog about the model Adam has created, which predicts whether or not a team will score a touchdown with an astonishing 96% accuracy, click here.
DISCLAIMER: All the graphs and info I am about to share with you are Albert’s work and were shared with me for distribution purposes. I have not created any of the graphs I am about to show you.
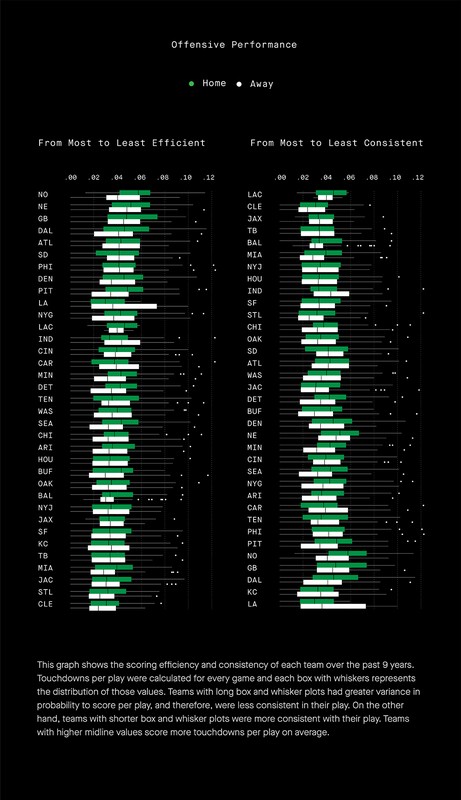
The chart above shows the efficiency and consistency of each NFL teams offense over the past nine years. The efficiency of a teams offense is defined as “touchdowns/play”. The consistency of each offense is defined as the “distribution of touchdowns/play across all games.”
The list of NFL teams from top to bottom orders each franchise from most to least efficient/consistent over the past nine years.
The New Orleans Saints have the highest efficiency rating and the Cleveland Browns have the lowest rating. For consistency, the L.A. Chargers are listed as the most consistent offense and the L.A. Rams are listed as the least consistent.
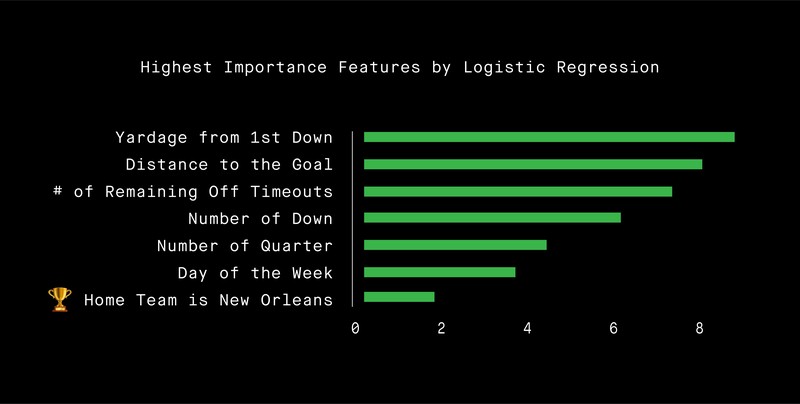
This graph shows the most important features that go into Albert’s prediction model for predicting whether or not a touchdown will be scored. Funny enough, his study showed that the New Orleans Saints’ offense was so prolific over the past nine years that just being the New Orleans Saints was one of the Top 10 predictors of whether or not a touchdown would be scored!
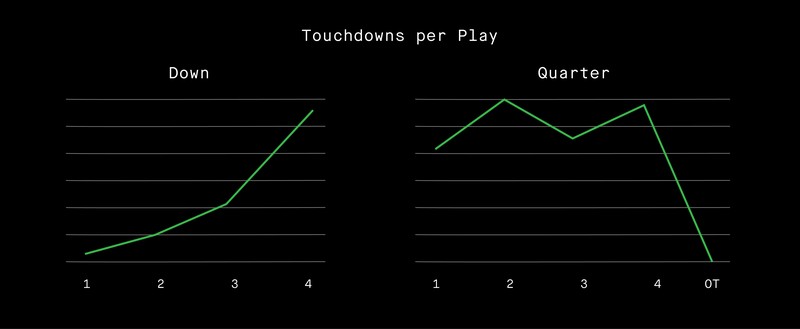
This last graph was the tendencies that Albert found in terms of the likeliest down that a touchdown would be scored on and which quarters had the most touchdowns scored in them.
The chances of a team scoring a touchdown drastically increases from third down to fourth down and the second and fourth quarters are when most touchdowns are scored throughout the NFL.
Now that you have seen these graphs and have found where your favorite NFL team lands on the efficiency/consistency charts please post a comment below telling me your thoughts as to why you think your team lands where they do in the rankings!
Comments