
Two weeks ago I was going to celebrate my first month at Scorum with an article about my impressions. Thinking about its plan I understood that it would be huge long-read and I decided to create some posts to describe everything by parts. Today I'll show you some numbers about Scorum.
We are lucky because Scorum is blockchain-based platform. So everyone can get its data if you have some abilities in coding. In my analisis the first date is June 13 (when blog platform was launched) and tha last is July 24. Lets check Scorum's progress by viewing to such characters as new users, posts, comments and votes. You can see this dynamisc on the next 2 charts.
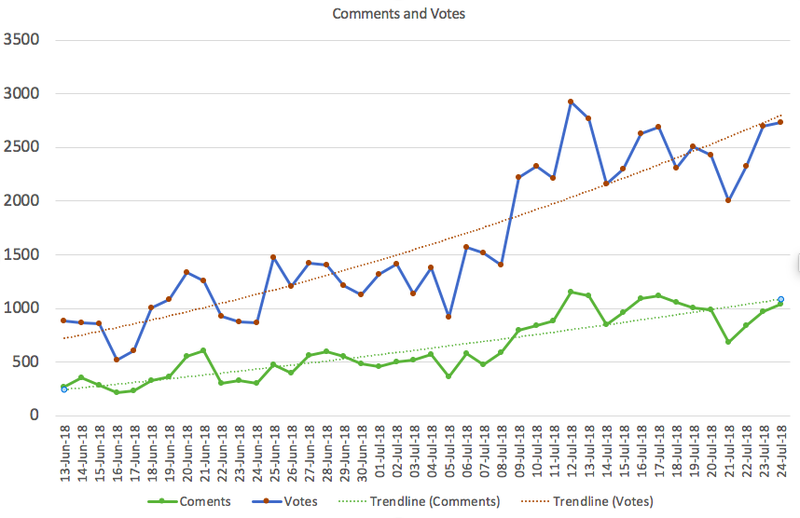
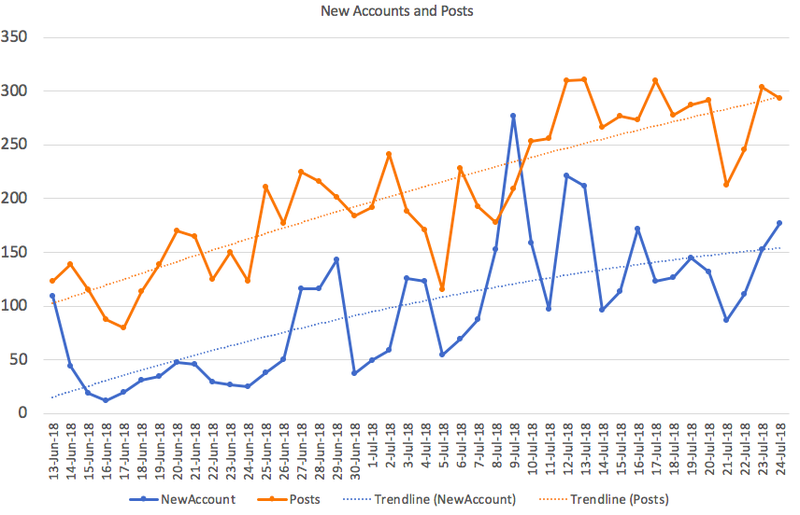
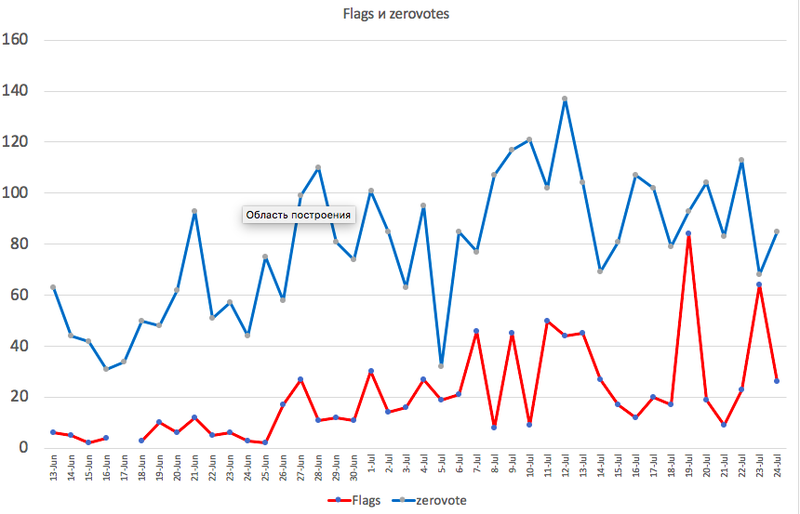
You can see trendlines at everychart and all of them are growing. Votes is the most interesting entity because in fact they consist of 3 parts (or categories): votes themselves, flags and cancelled votes (I call them zerovotes). Flags and zerovotes dynamic is showen on the chart below.
The next interesing thing is to find when users do actions on Scorum. This information is showed in tables below. You should remember that timezone is GMT. Green colour means high activity, red - low.
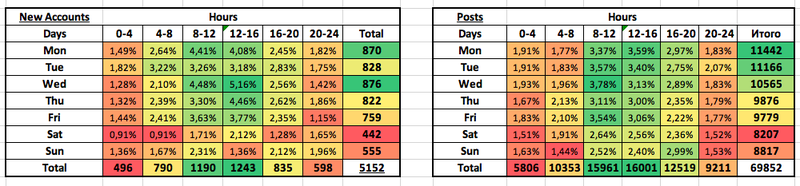
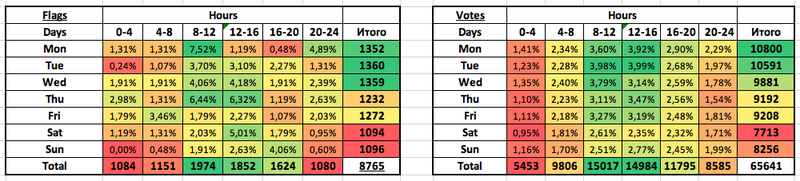
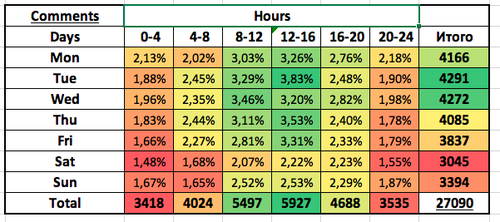
So as we see the majority of actions are done in period from Monday to Friday from 8 AM to 4 PM. But authors also actively publish their posts later - from 4 PM till 8 PM. I'd like to reccomend authors to publish their articles in the morning.
For today that is all statistics I wanted to share with you. I hope in future I will understand Scorum blockchain deeper and will share more interesting facts with you. But I hope that this info is also usefull for you. Please write in comments what data is intersting for you?
Comments